


Heat Transfer (HT) is the thermal energy in transit due to a temperature difference. This means that the existence of temperature difference leads to HT occurring in a medium or between media.
There are different types or modes of HT processes as listed below:

The HT processes can be quantified using rate equations to compute the amount of energy transferred per unit time.
Can be viewed as the transfer of energy from a more energetic particles in a substance to less energetic ones due to interactions between the particles. Conduction is therefore heat transfer (HT) through a substance that has no bulk (macroscopic) motion e.g., solids.
A
high temperature means high molecular energy thus neighboring molecules collide;
energy is transferred to the less energetic molecules. Thus, when a temperature
gradient exists, energy transfer by conduction occurs in the direction of
decreasing temperature.
For
heat conduction, the rate equation is known as Fourier’s Law of Heat
Conduction.

For
a 1 – dimensional plane wall shown above, having a temperature distribution T(x), the rate
equation is expressed as follows:

qx = heat flux in x-direction
k = thermal conductivity (W/m.K) [this is a characteristic of the wall material]
dT/dx = temperature gradient
If k is a constant, the heat flux can be calculated as:

The
negative sign is due to HT occurring in the direction of decreasing
temperature.
Under
steady state conditions, the temperature distribution is linear and can be
expressed as:

The
heat flux can therefore be simplified into:

Or

NOTE:
The above equation is the rate of HT per unit area, thus the heat rate by
conduction through a plane wall of Area, A, is the product of the heat flux and
the area.
This is heat transfer (HT) between a surface and a moving fluid at different temperatures.
It is comprised of two mechanisms:
Convection is used when referring to the cumulative transport, while advection is the transport due to bulk fluid motion.

A region in the fluid develops where the fluid velocity varies from zero at the surface to a finite value u∞ at the outer region of the fluid. This region is known as a boundary or hydrodynamic layer.
Also, if the temperature of the surface varies from the flow temperature, the fluid region will have varying temperature from Ts at the surface (y=0) to T∞ at the outer region of the fluid. This is the thermal boundary layer. If Ts > T∞ convective HT occurs from the surface to outer flow.
At the surface (y=0), fluid velocity is zero and heat us transferred only by random molecular motion (diffusion) while bulk fluid motion increases as the boundary layer grows.
Convection can be classified according to nature of flow:
Below is a table summarizing the heat transfer coefficient of convection processes:

The general rate equation for convection is known as Newton’s law of cooling and is represented as:

Where:
qx = convective heat flux (W/m2)
Ts = Surface temperature (K)
T∞ = Fluid temperature (K)
h = Convection HT coefficient (W/m2.K)
Thermal radiation is the energy emitted by matter at a non-zero temperature. The energy of the radiation is transferred by electromagnetic waves.
While conduction and convection need material medium for heat transfer (HT), radiation can occur efficiently in a vacuum.
Radiation emitted by the surface originated from the thermal energy of matter bound by the surface as shown below:

The rate at which energy is released per unit area (W/m2) is termed as the surface emittive power, E. For an ideal emitter, this is expressed by the Steffan-Boltzmann law and such a surface is called an ideal radiator or blackbody.
Where:
T = Absolute temperature of the surface (K)
σ = Stefan-Boltzmann constant (σ = 5.67 x 10⁻⁸ W/m4.K4)
However, for a real surface heat flux emitted is less than that of a blackbody. A radioactive property of the surface known as emissivity, ε. Is used to modify the above equation into the following:

Emissivity is in the range 0≤ ε ≤1 and provides a measure of how efficiently a surface emits energy relative to a blackbody.
Irradiation (G) is the radiation from any source like the sun, that is incident on a unit area of the surface. This radiation can be absorbed, reflected or transmitted by the surface.
Absorptivity (α), is the rate at which radiant energy is absorbed per unit surface area and is in the range 0≤ α ≤1. It can be expressed as:
If α < 1 and surface is opaque, then portions of irradiation are reflected. If surface is semitransparent, portions of irradiation is transmitted.
A special case that occurs frequently involves radiation exchange between a small surface at Ts and a much larger, isothermal surface that completely surrounds the smaller one a Tsurr.
When α = ε the surface is called a gray surface.
Irradiation can be approximated by emission from a blackbody at Tsurr in which case, G = σTsurr4.
For a gray surface, the net rate of radiation HT from the surface per unit area is:

The above equation represents the difference between thermal energy released due to radiation emission and that gained due to radiation absorption.
The Avogadro Number is
the proportionality factor that relates the number of constituent particles
(molecules, atoms or ions) contained in one mole of a substance. Its SI unit is
the reciprocal mole, and is exactly 6.02×10²³ mol−1.
Robert Millikan, an
American Physicist, was the first to measure the charge on an electron which
helped determine the Avogadro’s Number. The electron charge is measured as
1.6021765 x 10⁻¹⁹ coulombs per electron. The Faraday is the charge
on a mole of electrons and is estimated as 96,485.34 coulombs per mole of
electron. The Avogadro’s Number is then obtained by dividing the charge on a
mole of electrons by the charge on a single electron i.e.,
Avogadro’s Number = (charge on a mole of electrons / charge
on a single electron)
= (96,485.34)
/ 1.6021765 x 10⁻¹⁹)
= 6.02 x
1023 particles per mole
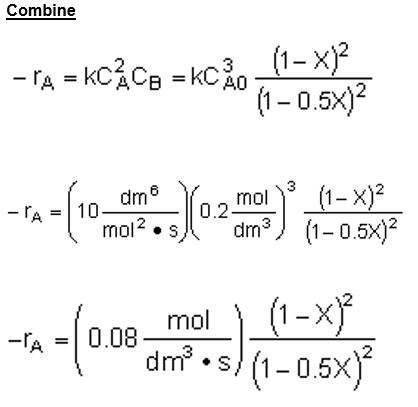
The following summarizations can be helpful when designing isothermal reactors.
The concentration of a species in a chemical reaction can be expressed as a function of conversion using the following algorithm.
.PNG)
The following is an algorithm that can be followed when designing an Isothermal-reaction for conversion.
.PNG)
.PNG)
(Source: Elements of Chemical Reaction Engineering (5th Edition) by H. Scott Fogler)
For flow systems, molar flow rates are used instead of number of moles are shown in the following table:

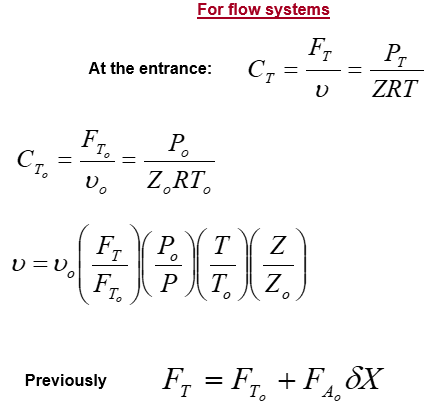


Let
us define the following variables:
Thus, we
can use the above definitions to describe the total moles in a batch system:
Let us
assume a reaction between reactants A and B to produce products C and D
occurring in a constant volume batch reactor. With A as the limiting reactant
and the basis of the reaction:
A table used to compute the changes and remaining quantities of each substance in the reaction in a constant volume batch reactor can be developed as follows:

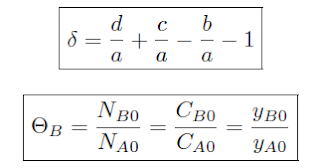
Using the mole fraction definition of Θ, for a constant volume batch reactor:

This
formula is for an arbitrary species i ≠ A, Species A is the limiting
reagent and i in the numerator represents the stoichiometric coefficient
of species i. For the ± , the addition represents generation of products
and the subtraction is for the consumption of reactants.
The
stoichiometric coefficient is defined as follows where for a substance I
with stoichiometric number i. It is positive for products and negative
for reactants:

In a
gas-phase reaction, the constant-volume condition tends to exist when n moles
of reactant form n moles of product and when there is no change in temperature
or pressure (i.e., ideal gas law states that volume is unchanged).
In liquid-phase
reaction, the solvent dominates the solution, hence the density of the solute
insignificantly impacts the system hence making most liquid-phase reactions
essentially constant-volume.
The following is a summary of reactor design equations discussed in previous entries:


The Temperature-Specific Volume Diagram
To
obtain this diagram we repeat the process discussed in the last blog entry
(Click Here) at different pressure values. The resulting curves for water look
as shown below:

It
can be observed that with increasing pressure the horizontal line connecting
saturated liquid and saturated vapor states becomes shorter. The reason is
that as pressure increases, the specific volume of saturated liquid increases
and the specific volume of the saturated vapor decreases. At P = 22.09MPa, the
horizontal line between the saturated liquid and vapor states shrinks to a
point at which the constant pressure line forms an inflection point with a
slope = 0. This point is referred to as the critical point.
At
a critical point, the saturated liquid and saturated vapor states are
identical and the temperature, pressure and specific volume of a substance at
this point are called the critical temperature, critical pressure and critical
volume, respectively. When the pressure is above the critical pressure, a
liquid and vapor phase of a pure substance does not exist in equilibrium.
The
saturated liquid states can be connected by a line called the saturated
liquid line while saturated vapor states are connected by a line called
the saturated vapor line. These two lines meet each other at the
critical point, forming a dome as shown:

All
the subcooled liquid states are located in the region to the left of the
saturated liquid line ad is referred to as the subcooled liquid region.
All
the superheated vapor states are located to the right of the saturated vapor
line and this is called the superheated vapor region.
In
these two regions locates outside the dome, a pure substance exists either in
liquid or vapor phase (single phase)
The region under the dome is called the saturated liquid-vapor mixture region where the liquid and vapor phases are in equilibrium.
The
Pressure-Specific Volume Diagram
For a pure substance, the Pressure-Specific Volume diagram is similar to that of Temperature-Specific Volume diagram, however, the isotherms (constant temperature) lines have a downward trend as can be seen below:

The
Pressure-Temperature (P-T) Diagram
Pure
substances can exist as solids, liquids or as a vapor. The P-T diagram is a
graphical method of showing the effects of pressure and temperature on the
phases of a pure substance. It is referred to as the phase diagram with the
three phases separated from one another by three lines as shown:

The
curve that separates the solid and vapor phases is called the sublimation
curve, and along it the solid and vapor phases are in equilibrium. The
slope of the sublimation curve gives the rate of change of sublimation pressure
of the solid with temperature.
The
curve that separates the solid and liquid phases is called the fusion (or
melting) curve, and along it the solid and liquid phases are in
equilibrium. Its slope gives the rate of change of melting or freezing of solid
with temperature. The fusion curve has a positive slope for most substances but
water has a negative slope.
The
curve that separates the liquid and vapor phases is called the vaporization
curve, and along it the vapor and liquid phases are in equilibrium.
Its slope gives the rate of change of vapor pressure of liquid with
temperature. This curve ends at the critical temperature and pressure of the
substance.
At
temperatures and pressures higher than the critical values, substances are called
supercritical fluids i.e., they exist in the fluid (or supercritical)
region. They possess both the gaseous properties (viscosity, diffusivity, surface
tension) of being able to easily diffuse into substances, and the liquid
property (density) of being able to dissolve substances.
When
P < Pc, a substance in the gaseous state is called either a gas (T
> Tc) or a vapor (T < Tc). Under isothermal
conditions, while a vapor can be liquefied by exerting pressure, a gas cannot
be liquefied regardless of what pressure is applied to it. That is, a pure gas cannot
be liquefied at temperatures above its critical temperature no matter what
pressure is applied to it.
On
the phase diagram, the point where the solid, liquid, and vapor phases coexist
in equilibrium is called the triple point. This is where the liquid-vapor
(vapor pressure curve), solid-liquid (fusion or melting curve), and solid-vapor
(sublimation pressure curve) coexistence curves intersect. The number of
degrees of freedom at the triple point is zero.
Since
the fusion curve generally has a very steep slope, the triple point temperature
for most substances is close to their melting (or freezing) temperature at
atmospheric pressure and this is known as the normal melting (or
freezing) point.
A pure substance is a substance that has a fixed chemical composition throughout. It can exist in more than one phase, but the chemical composition must be the same in all phases. An example of this is ice-liquid water mixture and liquid water-steam mixture.
Scenario:
Let us consider a system consisting 1 Kg of liquid water in a piston cylinder
apparatus as shown below. Assume that the ambient pressure and the piston
weight maintain the cylinders pressure at 0.125MPa with the initial temperature
at 25°C.

At the initial conditions (P = 0.125MPa, T = 25°C), water is a called subcooled liquid i.e., it will not vaporize if heat is transferred to the system.
When heat is transferred to the water, its temperature increases significantly and the specific volume increases slightly while pressure remains constant.
When T = 105.99°C, the additional heat transfer results in the water boiling and a phase change occurs. A liquid that is about to boil is referred to as a saturated liquid.
When the liquid is vaporizing, its pressure and temperature remain constant but its specific volume increases. At this point it is called a saturated liquid-vapour mixture where both liquid and vapour phases coexist in equilibrium.
When all liquid vapourizes, only vapour exists in the cylinder and is called saturated vapour. Any heat loss from a saturated vapour leads to condensation.
An increase in heat into a saturated vapour leads to an increase in both temperature and specific volume and its called a superheated vapour.
This
whole water heating process at a constant pressure can be represented on a T - Ṽ diagram as shown below:

At any given pressure, the temperature at which a pure substance boils is referred to as the saturation temperature (Tsat). While at any given temperature, the pressure at which a pure substance boils is referred to as the vapour or saturation pressure (Pvap). For a pure substance, there is a definite relation between the vapour pressure and the saturation temperature which results in a vapour pressure curve shown below. The boiling of a pure component starts when the Pvap = Ambient Pressure. This explains why water boils at a temperature less than 100°C at a mountain top.

In this topic we are interested in the efficiency of heat engines. We are going to build upon the knowledge of thermodynamics and show how h...


