Chemical Engineering Tutorials

Friday, 25 February 2022

Batch Systems

Let us define the following variables:


Thus, we can use the above definitions to describe the total moles in a batch system:


Let us assume a reaction between reactants A and B to produce products C and D occurring in a constant volume batch reactor. With A as the limiting reactant and the basis of the reaction:


A table used to compute the changes and remaining quantities of each substance in the reaction in a constant volume batch reactor can be developed as follows:


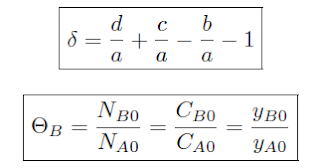
Using the mole fraction definition of Θ, for a constant volume batch reactor:


This formula is for an arbitrary species i ≠ A, Species A is the limiting reagent and i in the numerator represents the stoichiometric coefficient of species i. For the ± , the addition represents generation of products and the subtraction is for the consumption of reactants.

The stoichiometric coefficient is defined as follows where for a substance I with stoichiometric number i. It is positive for products and negative for reactants:


In a gas-phase reaction, the constant-volume condition tends to exist when n moles of reactant form n moles of product and when there is no change in temperature or pressure (i.e., ideal gas law states that volume is unchanged).

In liquid-phase reaction, the solvent dominates the solution, hence the density of the solute insignificantly impacts the system hence making most liquid-phase reactions essentially constant-volume.


Monday, 31 January 2022

Short Notes #3

 The following is a summary of reactor design equations discussed in previous entries:


Wednesday, 12 January 2022

PVT DIAGRAMS FOR PURE SUBSTANCES

 The Temperature-Specific Volume Diagram

To obtain this diagram we repeat the process discussed in the last blog entry (Click Here) at different pressure values. The resulting curves for water look as shown below:


It can be observed that with increasing pressure the horizontal line connecting saturated liquid and saturated vapor states becomes shorter. The reason is that as pressure increases, the specific volume of saturated liquid increases and the specific volume of the saturated vapor decreases. At P = 22.09MPa, the horizontal line between the saturated liquid and vapor states shrinks to a point at which the constant pressure line forms an inflection point with a slope = 0. This point is referred to as the critical point.

At a critical point, the saturated liquid and saturated vapor states are identical and the temperature, pressure and specific volume of a substance at this point are called the critical temperature, critical pressure and critical volume, respectively. When the pressure is above the critical pressure, a liquid and vapor phase of a pure substance does not exist in equilibrium.

The saturated liquid states can be connected by a line called the saturated liquid line while saturated vapor states are connected by a line called the saturated vapor line. These two lines meet each other at the critical point, forming a dome as shown:


All the subcooled liquid states are located in the region to the left of the saturated liquid line ad is referred to as the subcooled liquid region.

All the superheated vapor states are located to the right of the saturated vapor line and this is called the superheated vapor region.

In these two regions locates outside the dome, a pure substance exists either in liquid or vapor phase (single phase)

The region under the dome is called the saturated liquid-vapor mixture region where the liquid and vapor phases are in equilibrium.

The Pressure-Specific Volume Diagram

For a pure substance, the Pressure-Specific Volume diagram is similar to that of Temperature-Specific Volume diagram, however, the isotherms (constant temperature) lines have a downward trend as can be seen below:


The Pressure-Temperature (P-T) Diagram

Pure substances can exist as solids, liquids or as a vapor. The P-T diagram is a graphical method of showing the effects of pressure and temperature on the phases of a pure substance. It is referred to as the phase diagram with the three phases separated from one another by three lines as shown:


The curve that separates the solid and vapor phases is called the sublimation curve, and along it the solid and vapor phases are in equilibrium. The slope of the sublimation curve gives the rate of change of sublimation pressure of the solid with temperature.

The curve that separates the solid and liquid phases is called the fusion (or melting) curve, and along it the solid and liquid phases are in equilibrium. Its slope gives the rate of change of melting or freezing of solid with temperature. The fusion curve has a positive slope for most substances but water has a negative slope.

The curve that separates the liquid and vapor phases is called the vaporization curve, and along it the vapor and liquid phases are in equilibrium. Its slope gives the rate of change of vapor pressure of liquid with temperature. This curve ends at the critical temperature and pressure of the substance.

At temperatures and pressures higher than the critical values, substances are called supercritical fluids i.e., they exist in the fluid (or supercritical) region. They possess both the gaseous properties (viscosity, diffusivity, surface tension) of being able to easily diffuse into substances, and the liquid property (density) of being able to dissolve substances.

When P < Pc, a substance in the gaseous state is called either a gas (T > Tc) or a vapor (T < Tc). Under isothermal conditions, while a vapor can be liquefied by exerting pressure, a gas cannot be liquefied regardless of what pressure is applied to it. That is, a pure gas cannot be liquefied at temperatures above its critical temperature no matter what pressure is applied to it.

On the phase diagram, the point where the solid, liquid, and vapor phases coexist in equilibrium is called the triple point. This is where the liquid-vapor (vapor pressure curve), solid-liquid (fusion or melting curve), and solid-vapor (sublimation pressure curve) coexistence curves intersect. The number of degrees of freedom at the triple point is zero.

Since the fusion curve generally has a very steep slope, the triple point temperature for most substances is close to their melting (or freezing) temperature at atmospheric pressure and this is known as the normal melting (or freezing) point.


Monday, 10 January 2022

Phase Change of a Pure Substance

A pure substance is a substance that has a fixed chemical composition throughout. It can exist in more than one phase, but the chemical composition must be the same in all phases. An example of this is ice-liquid water mixture and liquid water-steam mixture.

Scenario: Let us consider a system consisting 1 Kg of liquid water in a piston cylinder apparatus as shown below. Assume that the ambient pressure and the piston weight maintain the cylinders pressure at 0.125MPa with the initial temperature at 25°C.


At the initial conditions (P = 0.125MPa, T = 25°C), water is a called subcooled liquid i.e., it will not vaporize if heat is transferred to the system. 

When heat is transferred to the water, its temperature increases significantly and the specific volume increases slightly while pressure remains constant. 

When T = 105.99°C, the additional heat transfer results in the water boiling and a phase change occurs. A liquid that is about to boil is referred to as a saturated liquid. 

When the liquid is vaporizing, its pressure and temperature remain constant but its specific volume increases. At this point it is called a saturated liquid-vapour mixture where both liquid and vapour phases coexist in equilibrium. 

When all liquid vapourizes, only vapour exists in the cylinder and is called saturated vapour. Any heat loss from a saturated vapour leads to condensation. 

An increase in heat into a saturated vapour leads to an increase in both temperature and specific volume and its called a superheated vapour.


This whole water heating process at a constant pressure can be represented on a T - Ṽ diagram as shown below:

  • State 1 is the initial subcooled liquid state
  • State 2 is the saturated liquid state. A saturated liquid is ready to boil with the addition of heat, and T = 105.99°C represents the boiling point temperature.

  • State 4 represents a saturated vapor. A saturated vapor is ready to condense with the removal of heat, and T = 105.99°C represents the dew point temperature.

  • The horizontal line joining states 2 and 4 represents an isobaric and isothermal process where phase change from liquid to vapor, or vice versa, occurs. During phase change the liquid and vapor phases are in equilibrium with each other and, as a result, both temperature and pressure remain constant.

  • The line joining the states 4 and 5 represents the process in which the steam is superheated at constant pressure.


At any given pressure, the temperature at which a pure substance boils is referred to as the saturation temperature (Tsat). While at any given temperature, the pressure at which a pure substance boils is referred to as the vapour or saturation pressure (Pvap). For a pure substance, there is a definite relation between the vapour pressure and the saturation temperature which results in a vapour pressure curve shown below. The boiling of a pure component starts when the Pvap = Ambient Pressure. This explains why water boils at a temperature less than 100°C at a mountain top.


Wednesday, 22 December 2021

Dimensionless Numbers #1

Dimensionless Groups in Chemical Engineering

Dimensionless Groups or numbers are relationships with no units of measurement and are often used in chemical engineering. 

There are numerous dimensionless numbers used by chemical engineers and this blog entry discusses the more common ones. The equations below are all in metric units, however, if you use consistent units, the dimensionless numbers remain unchanged.

Reynolds Number (Re)

This is arguably the most commonly used dimensionless group in chemical engineering.  It gives a measure of the ratio of inertial and viscous forces in fluid flow and is often used to determine if the flow is either laminar or turbulent:

  • In laminar flow, viscous forces dominate. The flow paths are smooth, streamline and constant.
  • In turbulent flow, inertial forces dominate. The flow regime is unstable, generating eddies and vortices.

The Reynolds Number can be calculated using the following equation:

Where:

  • ρ = Fluid density (kg/m3)
  • u = Fluid velocity (m/s)
  • L = Characteristic dimension (m)
  • μ = Dynamic viscosity (Pa.s)

When calculating Reynolds Number, the units used are not important but MUST be consistent. For pipes or channels with circular cross-section, the characteristic dimension can be taken as the pipe diameter.

For flow through pipes, Reynolds Number below 2000 indicates laminar flow while a Reynolds Number above 4000 indicates turbulent flow. Reynold Numbers between 2000 and 4000 indicate transitional flow i.e., rapidly changing between laminar and turbulent flow.

Prandtl Number (Pr)

This is the ratio of kinematic viscosity to the thermal diffusivity. Prandtl Number can also be defined as the ratio of momentum and thermal diffusivities. It tells us how fast the thermal diffusion occurs as compared to momentum diffusion in fluids. It is used in many calculations involving heat transfer in flowing fluids, as it gives a measure of the relative thickness of the thermal and momentum boundary layers.  It can be calculated using the following equation:

Where:

  • CP = Fluid Specific Heat Capacity (J/kg.K)
  • μ = Dynamic viscosity (Pa/s)
  • k = Thermal conductivity (W/m.K)
  • ν = Momentum or Kinematic diffusivity (m2/s)
  • α = Thermal diffusivity (m2/s)

It should be noted that the Prandtl number is dependent on the fluid’s physical properties alone and hence it is often found in physical properties.  

For many gases (with the notable exception of hydrogen), the Prandtl number has a value of 0.6 to 0.8 over a wide range of conditions. If the Pr << 1, then thermal diffusivity dominates and when Pr >> 1, then momentum diffusivity dominates

Nusselt Number (Nu)

This is the ratio of convective to conductive heat transfer in a fluid over a given length, L:

Where:

  • h = Heat Transfer Coefficient (W/m2.K)
  • L = Characteristic length (m)
  • k = Thermal conductivity (W/m.K)

For heat transfer in pipes, the characteristic length is the pipe diameter.

When Nu ≈ 1 then convection and conduction are about equal.  Typically, this occurs in laminar conditions.  As the Nusselt number becomes larger, convective heat transfer becomes relatively more important – this occurs as the flow becomes more turbulent.  

The mass transfer equivalent of the Nusselt number is the Sherwood Number discussed next.

Sherwood Number (Sh)

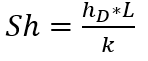
This is a measure of the ratio of convective and diffusive mass transfer in a fluid.  It is analogous to the Nusselt Number in heat transfer and summarized as shown:


Where:


  • hD = Mass Transfer Coefficient (m/s)
  • L = Characteristic length (m)
  • k = Molecular Diffusivity (m2/s)

Froude Number (Fr)

It is a measure of the ratio of the inertial and gravitational forces and can be expressed as:     

Where:


  • v = Velocity (m/s)
  • g = Acceleration due to gravity (m/s2)
  • L = Characteristic length (m)

It is often used to analyze fluid flow problems on a free surface.  For example, in agitated vessels, Fr governs the formation of free surface vortices:

Grashof Number (Gr)

This is a ratio of the buoyancy and viscous forces. It is used to calculate heat transfer in natural convection where the fluid velocity depends on buoyancy.  It can be expressed as:


Where:


  • β = Volumetric coefficient of thermal expansion (1/K)
  • g = Acceleration due to gravity (m/s2)
  • ΔT = Temperature difference (K)
  • L = Characteristic length (m)
  • ρ = Fluid Density (kg/m3)
  • μ = Dynamic Viscosity (Pa.s)


Mach Number (Ma)

This is the ratio of the fluid velocity to the velocity of sound in that medium.  It can be expressed as:

Where:


  • u = Fluid velocity (m/s)
  • a = Speed of sound in fluid medium (m/s)


In Chemical Engineering, the Mach Number is commonly used in calculations that involve high velocity gas flow.


Schmidt Number (Sc)

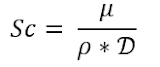
This is the ratio of kinematic viscosity to the diffusivity and it characterizes mass transfer in a flowing fluid. It can be expressed as:
Where:

  • μ = Dynamic viscosity (Pa/s)
  • ρ = Fluid Density (kg/m3)
  • D = Diffusivity (m2/s)

Biot Number (Bi)

It is the ratio of the internal thermal resistance of a solid to the boundary layer species transfer resistance. It can also be defined as the ratio of internal conductive resistance to the external convective resistance. It is represented as shown:

Where:

  • h = Convective heat transfer coefficient (W/m2.K)
  • LC = Characteristic Length (m)
  • k = Thermal conductivity (W/m.K)


Bi < 0.1 indicates the applicability of the lumped heat analysis.

Biot Number helps analyze the interaction between conduction in a solid and convection at its surface. Smaller Bi number values signify that conduction is dominating the heat transfer mechanism while larger Bi number values signify that convection is dominating the heat transfer process.
Thursday, 4 November 2021

Short Notes #2

Isothermal Process Vs. Adiabatic Process

Isothermal and adiabatic processes are important concepts with thermodynamics and chemical engineering students should grasps these concepts, Below are some basic differences between the two processes:

Isothermal Process

Adiabatic Process

It is a thermodynamic process that occurs under a constant temperature

It is a thermodynamic process that occurs without any heat transfer between a system and its surroundings

The temperature is constant

The temperature can change

Heat transfer can be observed

No heat transfer

Work done is due to the change in the net heat content of the system

Work done is due to the change in its internal energy


Absorption vs Adsorption

Both are some of the most important mass transfer processes used in chemical and process industries and are called sorption process. A Sorption Process is a physical or a chemical process by which one substance becomes attached to another substance. Another sorption process is Ion Exchange process.

Absorption is a process where components from a gas phase transfer into a liquid phase when the gas phase and liquid phase are brought into contact. On the other hand. 

Adsorption is a process where components from a gas phase or a liquid phase are attached to the surface of a solid phase when the gas phase or the liquid phase is brought in contact to the solid phase. Adsorption is a surface phenomenon.


Absorption

Adsorption

The substance penetrates the surface

It is a surface phenomenon

Occurs at a uniform rate

Initially the rate increases then decreases

Unaffected by temperature

Affected by temperature

It is the same throughout the material

Concentration on the surface of absorbent is different from that in the bulk

It is an endothermic process

It is an endothermic process


The Heat Diffusion Equation

It is important to know the temperature distribution as it allows us to see how temperature varies with position inside a medium. Once the d...